
Power spectral density (PSD), often referred to as acceleration spectral density or vibration ASD, is a measure of signal power content and frequency, which can estimate the distribution of signal strength in the spectrum for quantitative analysis and comparison of different vibration environments, and is a powerful analytical tool for understanding and describing random vibration. PSD is usually used to characterize broadband random signals. The amplitude of the PSD is normalized by the spectral resolution used to digitize the signal.
For vibration data, the amplitude of the PSD is measured in g2/Hz. While this unit may not seem intuitive at first glance, it helps ensure that random data can be superimposed and compared without being affected by the spectral resolution used to measure the data
Power: The mean square value of the signal reflects its amplitude, indicating how far the signal deviates from zero on average. Power spectral density (PSD vibration testing) shows the mean square amplitude or “power” of the signal over the spectrum. In this context, “power” refers to the distribution of signal energy across the spectrum, rather than physical units such as watts or horsepower.
Spectrum: Power spectral density (PSD) is a function of frequency, indicating the distribution of the signal over different frequencies. It can be compared to a rainbow, which shows the distribution of light in a range of different wavelengths (colors).
Density: The amplitude of the power spectrum density (PSD) is normalized to accommodate the bandwidth of a single Hertz (Hz). For example, the PSD of an acceleration signal in G is G²/Hz. The PSD provides information on the power distribution of the signal at different frequencies. Normalization to units per Hertz makes it easy for engineers to compare signals acquired at different sampling rates or frequency resolutions.
Let’s take a quick look at PSD through a scenario
The same broadband data was measured three times, with each measurement changing only the frequency resolution. The data was first collected at a frequency resolution of 1 Hz, then at 4 Hz, and finally at 8 Hz. There are significant differences in the amplitude of the resulting automatic power data (see Figure 1). Why is that? Which data is correct?
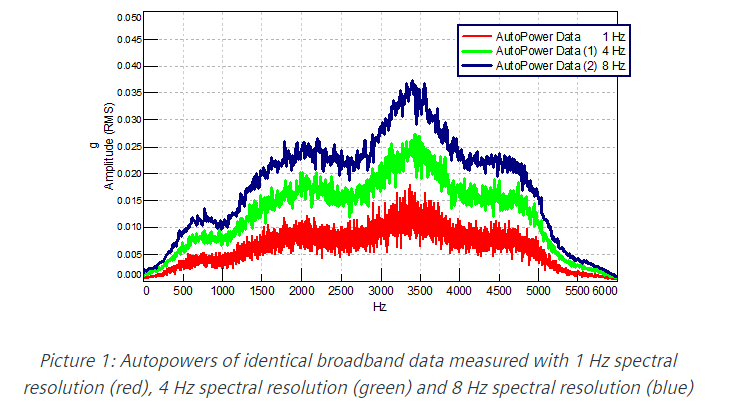
Answer: All the automatic power data is correct! However, they visually show different amplitudes, which can be confusing.
As the frequency resolution (sometimes called spectral resolution) becomes finer (from 8 Hz to 4 Hz, then to 1 Hz), the number of data points used to measure the signal gradually increases. The same signal is divided into smaller parts, but the overall energy remains the same.
Although the amplitudes of each frequency appear to be different, the sum of the data remains consistent across the frequency range.
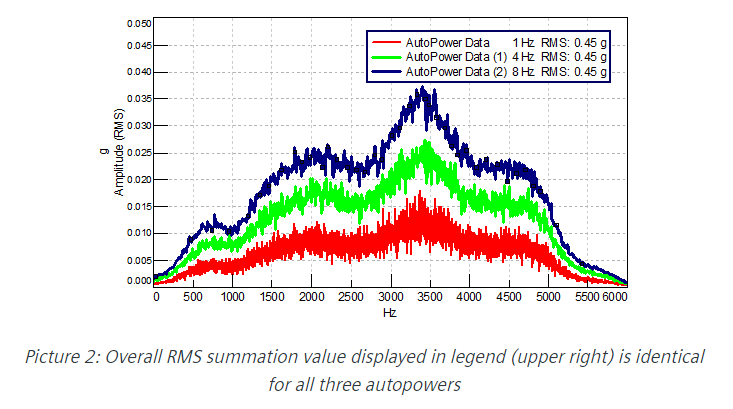
The “sum” of the signal is reflected in the sum of the RMS across the spectrum, as shown in Figure 2. The RMS sum is the same for all three self-power spectra.
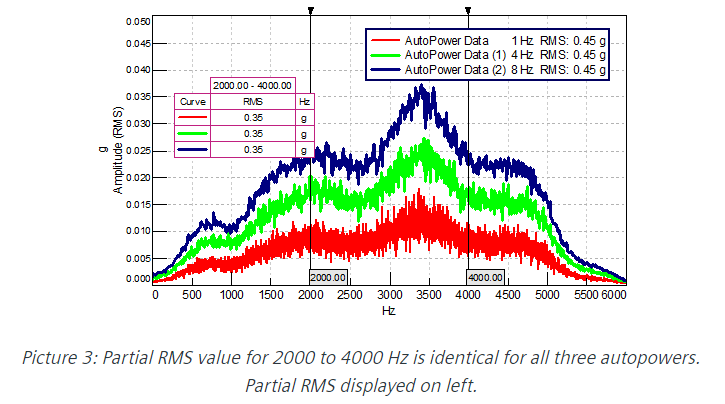
Even the partial root-mean-square (RMS) sum of data based on a smaller frequency range (see Figure 3) is the same for all three measurements.